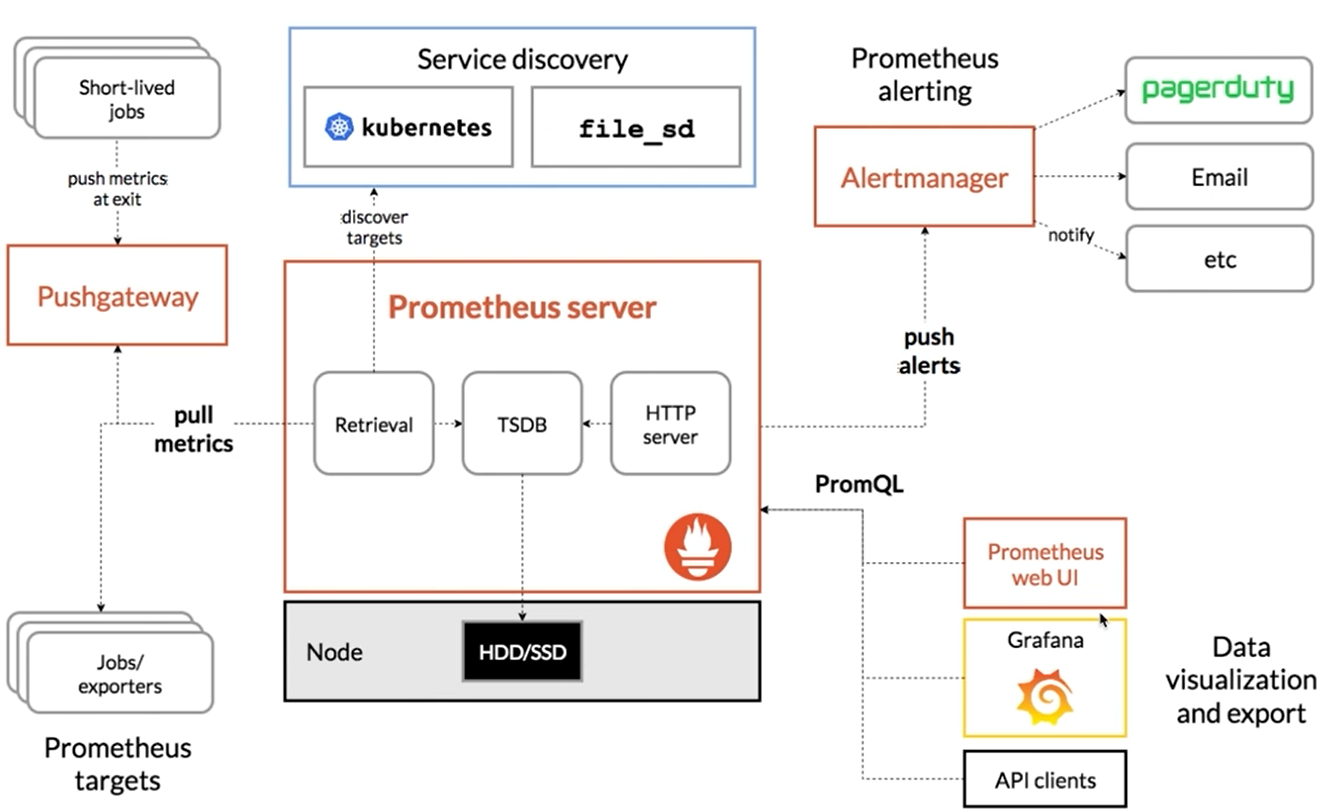
Prometheus
소개
Metric collecting
- Push
- Coupling metric backend system
- require (agent | login) per application
- Pull
- require service discovery
- easy to update setting
- Push
Prometheus
Features
- multi-dimensional data model
- PromQL
- no reliance on distributed storage
- via pull method over HTTP
- pushing time series is support (gateway)
- targets r discovered via service discovery or static conf
Metric types
Counter
- cumulative metric (reset 0)
- ex)
- total req
- total send/receive bytes
- uptime
Gauge
- single numerical value (up & down)
- ex)
- cpu / memory usage
- temperature
- concurrent req
- thread cnt
Histogram
- samples observations (샘플링을 관찰)
- ex)
- <basename>_bucket{le="<upper inclusive bound>"}
- SLO to serve 95% of req within 300ms
- http_request_duration_seconds_bucket{le="0.3"}
- SLO to serve 95% of req within 300ms
- <basename>_sum
- <basename>_count
- <basename>_bucket{le="<upper inclusive bound>"}
Summary
samples observations
- ex)
- <basename>{quantile="<Ψ>"}
- <basename>_sum
- <basename>_count


