Storage
- You can use the default local on-disk storage, or optionally the remote storage system
- Local storage: a local time series database in a custom Prometheus format
- Remote storage: you can read/write samples to a remote system in a standardized format
- Currently it uses a snappy-compressed protocol buffer encoding over HTTP, but might change in the future (to use gRPC or HTTP/2)
Local Storage
- Prometheus >= 2.0 uses a new storage engine which dramatically increases scalability
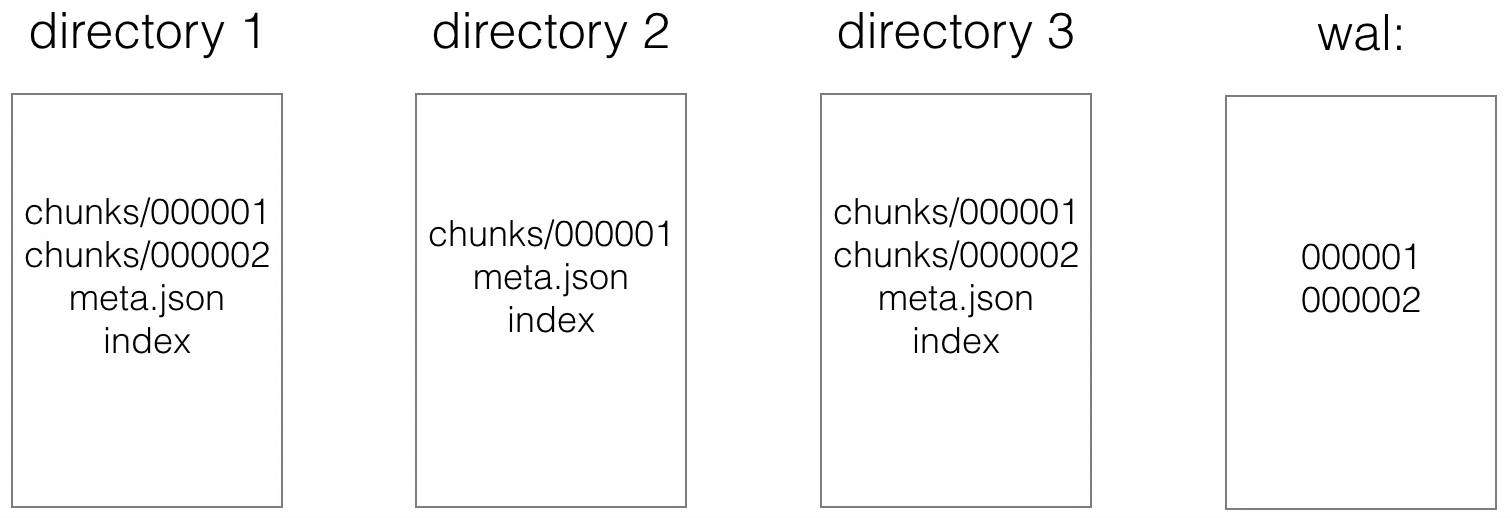
- Ingested samples are grouped in blocks of two hours
- Those 2h samples are stored in separate directories (in the data directory of Prometheus)
- Writes are batched and written to disk in chunks, containing multiple data points
- Every directory also has an index file (index) and a metadata file (meta.json)
- It stores the metric names and the labels, and provides an index form the metric names and labels to the series in the chunk files
- The most recent data is kept in memory
- You don't want to loose the in-memory data during a crash, so the data also needs to be persisted to disk. This is done using a write-ahead-log (WAL)
- Write Ahead Log (WAL)
- it's quicker to append to a file (like a log) than making(multiple) random read/writes
- If there's a server crash and the data from memory is lost, then the WAL will be replayed
- This way no data will to lost or corrupted during a crash
- When series gets deleted, a tombstone file gets create
- The initial 2-hour blocks are merged in the background to from longer blocks
- This is called compaction
Remote Storage
- Remote storage is primarily focused at long term storage
- Currently there are adapters available for the following solutions:
AppOptics: write Graphite: write Chronix: write InfluxDB: read and write Cortex: read and write OpenTSDB: write CreateDB: read and write PostgreSQL/TimescaleDB: read and write Gnocchi: write SignalFx: write Source: https://prometheus.io/docs/operating/integrations/@remote-endpoints-and-storage


